Floods are natural occurrences that can occur almost anywhere. They might not even be near a body of water, despite river and coastal flooding being two of the most common types. Flood damage can be caused by heavy rains, poor drainage, and even nearby construction projects.
Not only is flooding one of the most common and costly disasters, but flood risks can also change over time because of new buildings and development, weather patterns and other factors. Although the frequency or severity of flood impacts cannot be altered, geoscientists can generate flood risk maps to promote informed planning and development practices to help reduce that risk.
Flood Risk Maps – Support Disaster Response and Preparedness
The increasing flood reports worldwide suggest the increasing vulnerabilities, such as the huge destruction of both life and property. Therefore, there is a need to become aware of flood hazards based on geographical locations. The flood risk maps depict the likelihood of flooding in a given area. They support NGOs and government agencies to support communities in developing risk-reduction strategies. The maps are also helpful to mortgage lenders in determining insurance requirements for various properties. Generally, it helps one understand flood risk and make more informed decisions about reducing or managing it.
Flood-prone counties in Kenya
Heavy rains and flash floods have been affecting Kenya on the onset of heavy rains in March-April-May (MAM) and October-November-December (OND) each year. According to the Kenya Red Cross, the counties most affected by the floods are Tana River, Garissa, Turkana, Kisumu, Mandera, Kakamega, Samburu, Isiolo, Wajir, Narok, Nakuru, Nyeri, Isiolo, Marsabit, and Homa Bay. KRCS had registered at least 42,064 HHs (252,384 people) displaced in 35 Kenyan counties as of June 17, 2020.
The society also identified 79 camps across the country where displaced people are accommodated, with the majority of them in Nyanza and Western Kenya – Kisumu, Busia, Homabay, and Migori – (51 camps) and the Coast – primarily Tana River county – (20 camps). The high intensity of floods observed in Tana River and Garissa counties is mainly due to the bursting banks of the Tana River.

The figure above indicates that the Tana River is the most affected county by floods in Kenya. This article will look at the specific areas/zones that are susceptible to floods in this county and use a flood map. The Tana River county takes its name from River Tana, which is the longest river in Kenya. According to the 2019 census, its population was 315 943 and 240,075 in 2009. According to KRCS, around 30,000 people are displaced by floods each year.
The county is mostly comprised of rangeland, with low and erratic convectional precipitation. The average annual rainfall is between 280 and 900 mm per annum. Rainfall is bimodal, with long rains falling from April to May (First Season) and short rains falling from October to December (Second Season). The temperature ranges from 23oC to 38oC at its coldest point.
The county’s topography rises from east to west with elevations ranging between <-15 m asl to 636 m above sea level. The lowest elevations are recorded around the coastal area and along the Tana River basin. Using the digital elevation model (DEM), we have analysed the stream lineaments and found that several streams popularly known as laggas feeding the Tana River traverse the county. During the heavy rains, these streams carry huge volumes of water from the Bilbil Hills in the western parts.
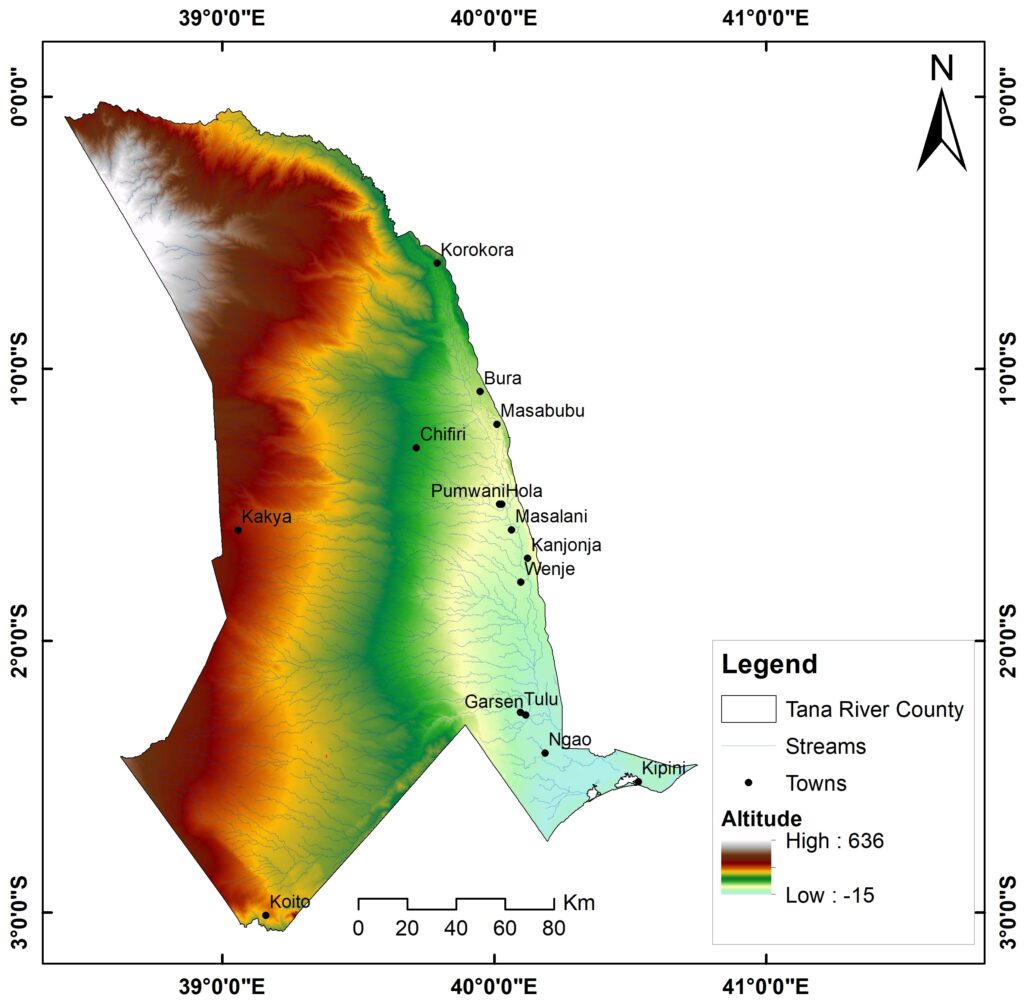
Digital elevation model for the Tana River county showing elevations between negative (-ve) 15 m below sea level to 636 m asl. Hilly areas are located to the west of the county.
Using GIS, we have generated a flood risk map of the Tana river county, showing at least four (4) flood risk levels based on elevation values. The highest risk zones are areas with less than 10 m asl and below 20 m asl. These areas are located southeast of the county within the Tana Delta.
The major towns vulnerable to these high-risk floods (red) include Garsen, Tulu, Ngao and Kipini. Medium risk flood zones where destructions of property are expected lie within 50 m asl. The floods in these zones are due to overflows of streams as they approach the Tana River. The moderate risk zone covers quite a vast area with elevation values between >50 m asl to 150 m asl. Disruption of transport and displacement of households are expected in this zone. Generally, low elevations, an influx of the Tana River and numerous streams contribute to the high intensity of flooding in Tana River county than any other county in Kenya.

Was this information helpful? Please send us your feedback at JFT Academy. Also, if you would like to assess the flood risk of your area or county, send us an email at info@jftacademy.com.